


Page 22 - Demo
P. 22
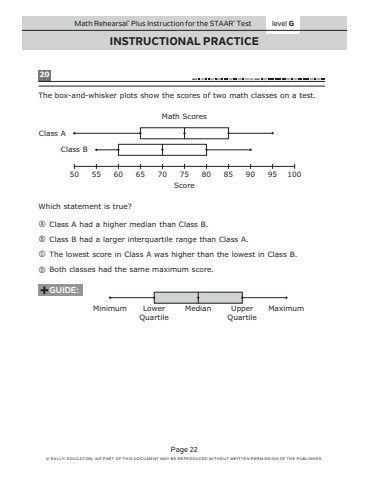
20The box-and-whisker plots show the scores of two math classes on a test.Which statement is true?A Class A had a higher median than Class B.B Class B had a larger interquartile range than Class A.C The lowest score in Class A was higher than the lowest in Class B.D Both classes had the same maximum score.50 55 60 65 70 85 90 95 100Class AMath ScoresScoreClass B75 80GUIDE:Minimum Lower MedianQuartileUpperQuartileMaximumINSTRUCTIONAL PRACTICEPage 22%u00a9 RALLY! EDUCATION. NO PART OF THIS DOCUMENT MAY BE REPRODUCED WITHOUT WRITTEN PERMISSION OF THE PUBLISHER.Math Rehearsal%u00ae Plus Instruction for the STAAR%u00ae Test level G


